
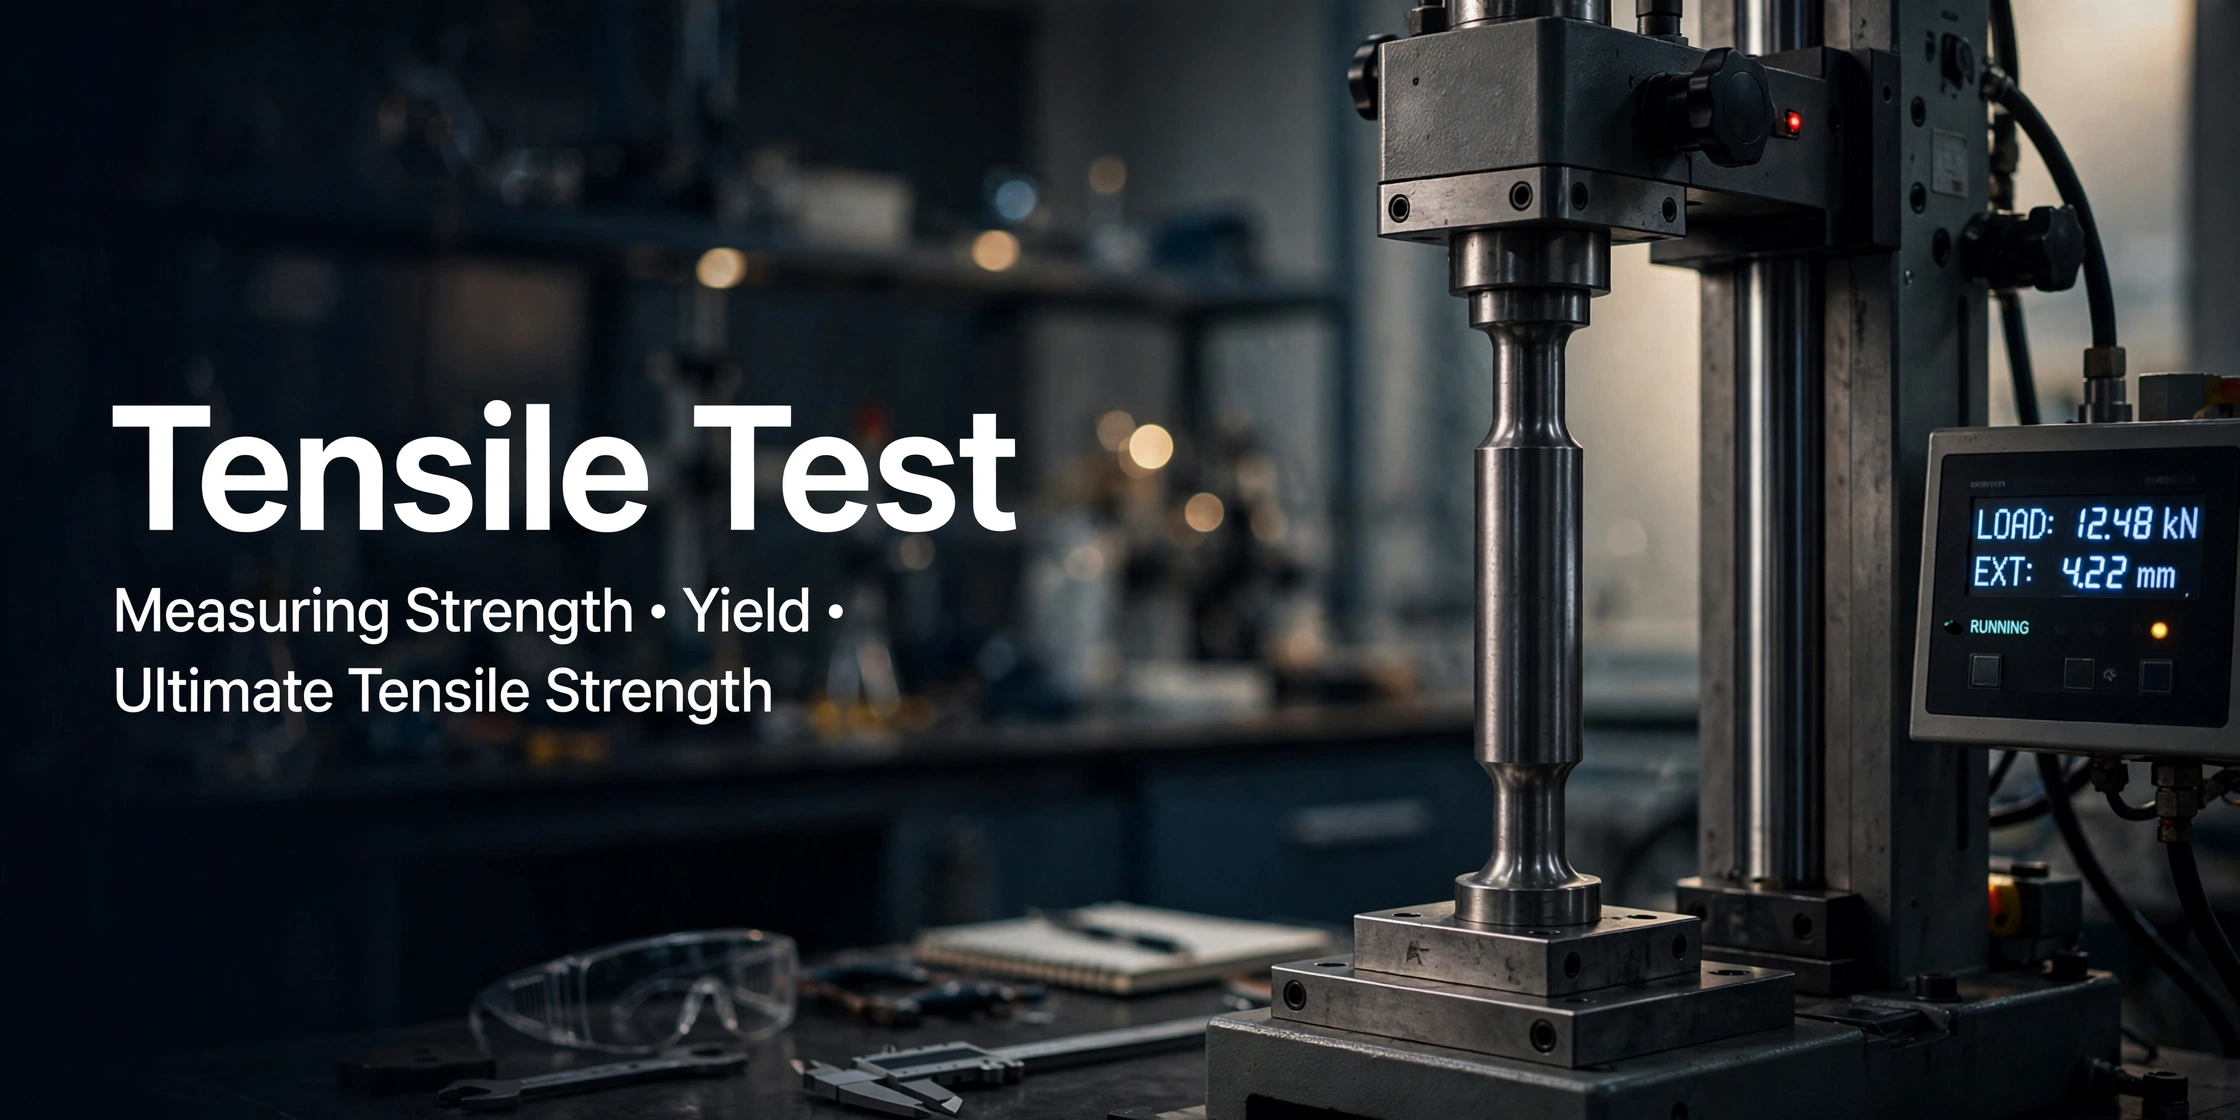
A complete guide for round specimens
Introduction:
Understanding how materials behave under load is one of the most fundamental requirements in mechanical and structural engineering. Among all mechanical tests, the tensile test—also called the tension test—stands as the most widely used and informative method for characterizing the mechanical properties of engineering materials. Whether it is mild steel, aluminium alloy, titanium, or even a polymer, the tensile test gives engineers a single, standardized window into a material’s strength, ductility, stiffness, and toughness.
In a tensile test, engineers first grip a carefully machined specimen at both ends. Next, they apply a gradually increasing axial force until it fractures the specimen. Throughout this process, they continuously record the applied force and the resulting elongation. Then, they convert these raw measurements into engineering stress and engineering strain. Finally, they plot these values against each other to produce the celebrated stress–strain curve. This curve serves as a graphical fingerprint of the material’s mechanical personality.
This blog walks you through every stage of the tensile test as performed on a standard round (circular cross-section) specimen, links each phase of the test to its corresponding region on the stress–strain curve, and explains what each region reveals to the design engineer.
The Round Tensile Specimen
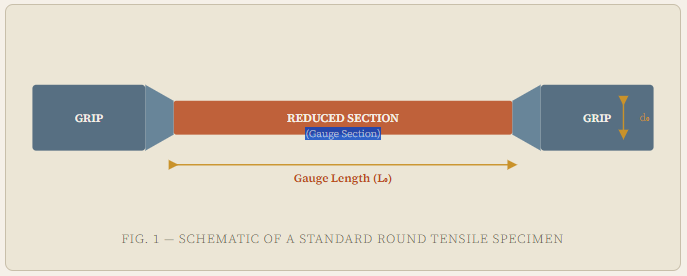
Before the test begins, technicians must first prepare the specimen. To do this, they follow a recognized standard. Common choices include ASTM E8/E8M (USA), IS 1608 (India), or BS EN ISO 6892-1 (Europe). For a round specimen, the key geometrical features include the following:
Standard Dimensions (Typical Round Specimen)
GAUGE DIAMETER (d₀): 12.5 mm or 8 mm (per ASTM E8)
GAUGE LENGTH (L₀): 5d₀ (proportional) or 50 mm (fixed)
PARALLEL LENGTH:
≥ L₀ + d₀
The shoulder radius blends smoothly into the reduced section to avoid stress concentration at the grips.
Before testing, technicians measure the original gauge length (L₀). They also measure the original cross-sectional area (A₀ = πd₀²/4). Then, they record these values precisely. Afterward, these values serve as the reference denominators for computing stress and strain throughout the test.
Equipment: The Universal Testing Machine (UTM):
Technicians perform the tensile test on a universal testing machine (UTM). The UTM consists of a fixed crosshead and a moving crosshead. An actuator, either hydraulic or electromechanical, drives the moving crosshead. Meanwhile, technicians clamp the specimen between two grips. One grip attaches to the fixed crosshead, and the other attaches to the moving crosshead.
A load cell continuously measures the applied force in Newtons or kN. Meanwhile, an extensometer measures the elongation, in mm, with high precision. This device is a clip-on attachment fixed directly to the gauge section. Additionally, modern UTMs are computer-controlled. As a result, they automatically record force–displacement data at high sampling rates. Then, the software converts this data into a stress–strain plot in real time.
Procedure of the Tensile Test
01. Specimen Preparation & Measurement:
Technicians machine the round specimen to the standard dimensions. Next, using a vernier caliper or micrometer, they measure the gauge diameter (d₀) at three locations along the gauge length. They then take the average of these measurements. After that, they mark the gauge length (L₀) with a fine punch or scriber at both ends of the gauge section.
02. Grip the Specimen:
Technicians secure the specimen firmly in the upper and lower grips of the UTM. In doing so, they ensure perfect axial alignment. Otherwise, misalignment causes bending stress, which then gives erroneous results. For round specimens, technicians commonly use self-aligning wedge grips or collet grips.
03. Attach the Extensometer:
Technicians clip the extensometer onto the gauge section. In doing so, they position its knife edges exactly at the punch marks defining L₀. This step ensures the elongation measured comes purely from the gauge section, not from the grips or shoulders.
04. Set Test Parameters:
Technicians set the crosshead speed, or strain rate, according to the standard. Typically, they use 0.015 min⁻¹ for the elastic region. Then, for the post-yield region, they increase this to 0.05–0.5 min⁻¹, per ASTM E8M. Before starting, they also zero and calibrate the data acquisition system.
05. Conduct the Test — Loading Phase:
The moving crosshead begins to travel at the set speed, applying a steadily increasing tensile (pulling) force to the specimen. The material first deforms elastically (reversibly), then plastically (permanently) as the load increases. The extensometer and load cell continuously send data to the computer.
06. Necking & Fracture:
Beyond the ultimate tensile strength (UTS), the specimen begins to neck. This process involves a localized reduction in diameter at one cross-section. Once necking initiates, technicians typically remove the extensometer to protect it. Meanwhile, the crosshead continues moving until the specimen fractures with a distinct audible snap.
07. Post-Fracture Measurements:
Technicians carefully fit the two broken halves back together. Next, they measure the final gauge length (Lf) between the original punch marks. They then measure the minimum diameter at the fracture neck (df). From this, they calculate the final area (Af = πdf²/4).
Stress & Strain Calculations:
From the test data, technicians derive the following quantities:
Core Formulae
Engineering Stress (σ):
σ = F / A₀ [Pa or MPa]
Engineering Strain (ε):
ε = (L − L₀) / L₀ [dimensionless or %]
Elastic Modulus (E):
E = σ / ε (in elastic region) [GPa]
% Elongation:
%EL = (Lf − L₀) / L₀ × 100
% Reduction in Area:
%RA = (A₀ − Af) / A₀ × 100
Note that engineering stress uses the original area A₀ throughout, even though the actual cross-sectional area changes. This is the standard reported curve. The true stress–true strain curve, which accounts for instantaneous area, lies above the engineering curve after yielding but is beyond the scope of this blog.
The Stress–Strain Curve:
Anatomy & Interpretation
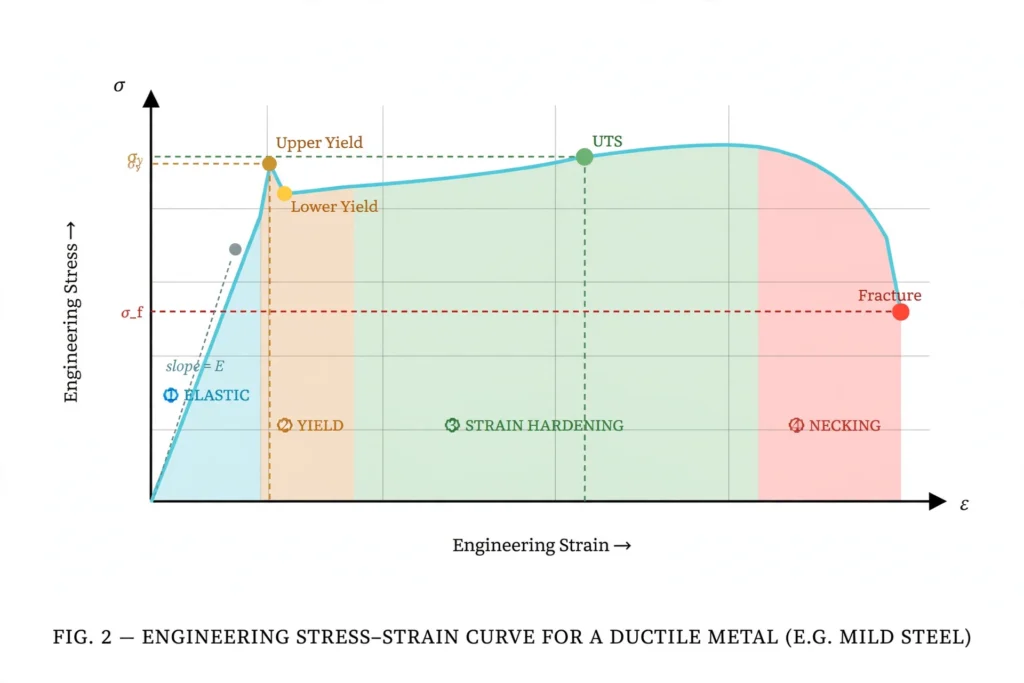
When the engineering stress is plotted on the Y-axis and engineering strain on the X-axis, the resulting curve — the stress–strain diagram — becomes the central document of the tensile test. For a typical ductile material like low-carbon (mild) steel, the curve has several distinct, well-defined regions.
① Elastic Region
In this region, atoms stretch their bonds. As a result, deformation remains fully reversible. Meanwhile, the curve forms a straight line—stress stays directly proportional to strain, following Hooke’s Law. So, if technicians release the load here, the specimen returns to its original length.
Key Property Obtained:
Young’s Modulus (E) = slope of line; Proportional Limit; elastic limit
② Yielding Region
Dislocations begin to move in bulk. Consequently, plastic, or permanent, deformation starts. In mild steel, this region shows a distinct upper yield point. Afterward, a lower yield point follows, along with a flat yield plateau, known as Lüders band propagation. However, most metals show a smooth transition instead. In these cases, technicians use the offset yield strength, or 0.2% proof stress, instead.
Key Property Obtained:
Yield Strength (σᵧ) — most critical design property
③ Strain Hardening
Dislocation density increases; dislocations impede each other’s movement. The material becomes stronger but less ductile as deformation continues. The curve rises to its highest point—the Ultimate Tensile Strength.
Key Property Obtained:
Ultimate Tensile Strength (UTS / σᵤ)
④ Necking & Fracture
Beyond UTS, plastic instability sets in at the weakest cross-section. As a result, a localized “neck” forms. Although the actual stress in the neck keeps rising—this is the true stress—the engineering stress drops instead. This drop happens because the calculation still uses A₀, the original area, in the denominator. Finally, the specimen fractures at the neck. In ductile metals, this fracture typically shows a characteristic cup-and-cone surface.
Key Property Obtained:
Fracture Stress, % Elongation, % Reduction in Area
Mechanical Properties Derived from the Test
Young’s Modulus (E)
Obtained as the slope of the linear elastic portion of the curve. It quantifies the stiffness of the material — how much it resists elastic deformation per unit stress. For mild steel, E ≈ 200 GPa; for aluminium, E ≈ 70 GPa. Engineers use this to calculate deflections in beams and structures under service loads.
Yield Strength (σᵧ)
The most critical design property. It represents the stress at which the material transitions from elastic to plastic behavior. Structural members are designed to ensure applied stresses remain safely below σᵧ with an appropriate factor of safety. For mild steel, σᵧ ≈ 250 MPa; for high-strength alloy steel, it may exceed 1000 MPa.
Ultimate Tensile Strength (UTS)
The maximum engineering stress the material can withstand before necking begins. UTS is the peak of the stress–strain curve. It is used to specify material grades (e.g., Fe 410 steel means UTS ≥ 410 MPa) and is relevant for components where catastrophic failure, not yielding, is the design limit
Ductility
Quantified as % elongation and % reduction in area. A highly ductile material (e.g., annealed copper, % EL ≈ 40–45%) absorbs significant energy before fracture, whereas a brittle material (e.g., cast iron) fractures with negligible plastic strain. Ductility is critical for metal-forming processes like drawing, rolling, and forging.
Toughness (Modulus of Toughness)
Represented by the total area under the entire stress–strain curve—from the origin to the fracture point. It combines both strength and ductility into a single energy-per-unit-volume measure and indicates the material’s ability to absorb energy before fracturing. High toughness is essential for structural applications subject to impact or dynamic loading.
Resilience (Modulus of Resilience)
The area under the elastic portion of the curve only (= σᵧ²/2E). It represents the maximum energy that can be stored elastically and fully recovered — important for springs and elastic components.
Conclusion:
The tensile test of a round specimen is a beautifully simple yet profoundly informative experiment. By pulling a standardized specimen to fracture in a UTM while recording force and elongation, engineers extract the complete mechanical biography of a material—its stiffness (Young’s modulus), resistance to yielding (yield strength), maximum load-carrying capacity (UTS), energy absorption (toughness), and capacity for plastic deformation (ductility).
The stress–strain curve is not merely a graph; it is a language. Each region narrates a different chapter of the material’s response—elastic stretching, dislocation glide, strain hardening, and finally the dramatic collapse of a neck. Mastering the interpretation of this curve is an indispensable skill for any mechanical, civil, or materials engineer involved in design, quality control, or failure analysis.
Whether you are selecting a steel grade for a bridge girder, qualifying a batch of alloy forgings, or investigating why a shaft fractured prematurely, the tensile test and its stress–strain curve remain, after more than a century of use, the cornerstone of mechanical characterization of engineering materials.
[…] Refer to our welcome blog […]