What is Stress strain curve?
The stress-strain curve is a graphical representation of the relationship between the stress (force per unit area) applied to a material and the resulting strain (deformation or displacement) in that material. It is used to understand the mechanical properties of materials under load.
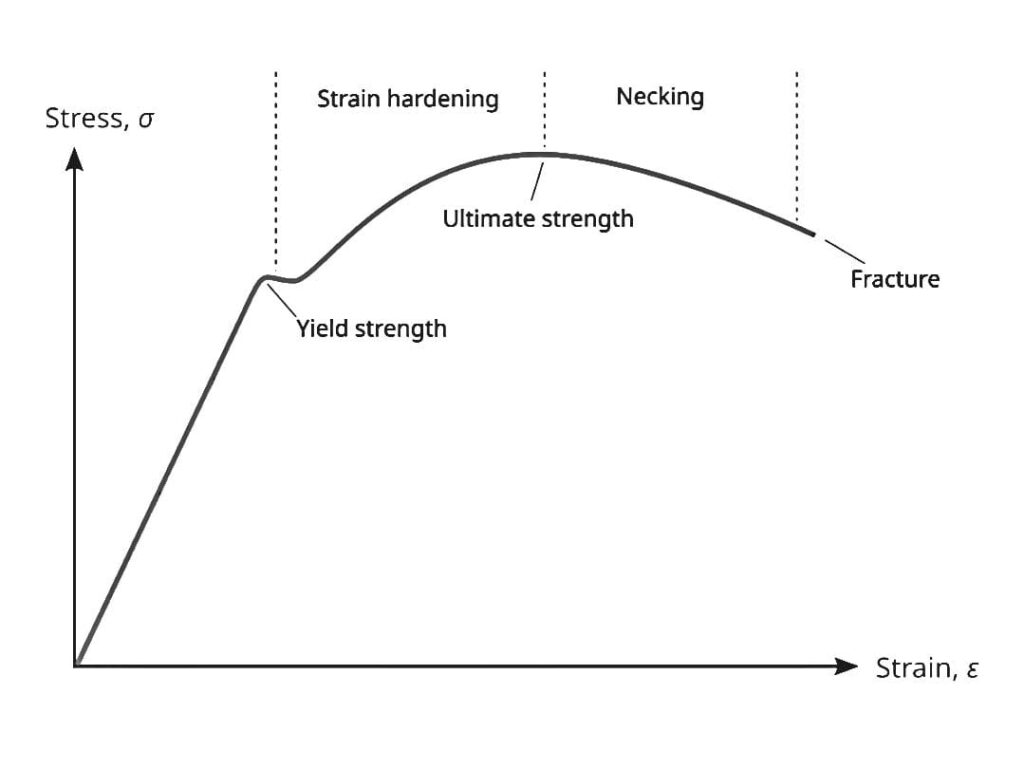
Stress strain curve diagram shown below:
Key points of the stress-strain curve:
1. Stress (σ)
- The stress is defined as the force applied per unit area within materials, commonly measured in Pascals (Pa) or N/m².
- In other words, if you apply force on a top edge of a cube and it deforms or moves parallel to the bottom face. then the cube is under stress.
- It is denoted by sigma (σ). additionally formula to calculate stress is

2. Strain (ε)
- The deformation or displacement of the material relative to its original length. It is a dimensionless quantity, often expressed as a percentage. However, in the example of the cube strain is change of shape with respect to original shape.
- It is denoted by epsilon (ε).

Typical Stress-Strain Curve Phases:
1. Proportional Limit:
In the curve we observe the elastic region however it is also known as the elastic limit.
In this region, the material behaves elastically, meaning it returns to its original shape after the stress is removed.
The relationship between stress and strain is linear additionally we can say stress is directionally proportional to strain and the slope of the curve in this region is called the modulus of elasticity or Young’s modulus
2. Elastic Limit:
In the curve the point beyond which the material will no longer return to its original shape even after the stress is removed, obvious that is transitioning from elastic to plastic behavior.
3. Yield Point:
However, The point where the material starts to undergo permanent deformation that is plastic deformation. It marks the end of elastic behavior of the material.
4. Strain Hardening:
After yielding, the material continues to deform with increasing stress in the plastic region. This is due to internal structural changes, such as dislocation movements, that make the material harder.
5. Ultimate Tensile Strength:
In the curve, The maximum stress the material can withstand before it starts to neck or fracture
even the curve achieve ultimate tensile strength though it it said that strain hardening region till it is achieved.
6. Fracture Point:
The point at which the material fails or breaks is known as fracture point.
Additionally, after the point of ultimate tensile strength material undergoes necking and at fracture point it breaks.
Conclusion:
The curve typically starts at the origin, rises linearly (elastic region), then curves or flattens out (plastic region), and eventually drops sharply at fracture.
This curve is crucial for engineers and material scientists to understand how materials will perform under various loading conditions.
How can we get such a curve for material, we will come up with this in our next blog.
you can refer our blog for SPM design.